| |
Interval & tools |
|
In this step you select the database
you want to work with. As default the database that is used by Resource
is selected. By clicking on the button '...' you can select another
database.
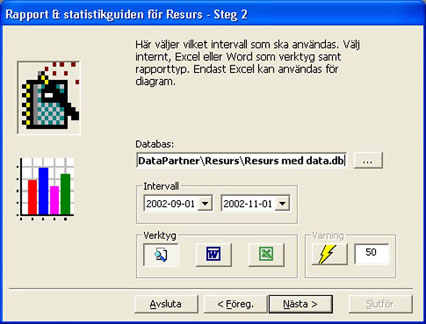
Afterward you select the interval the report shall
cover. The left date is the start date and the right one is end
date. Standard value is today's date in both. To go on you have
to select at least one day as interval.
Depending on what report you have selected in the
previous step you can select which tool to use to produce the report.
If you have Word and Excel from Microsoft there is three tools to
choose from. Starting from the left side there is an internal tool
which is the fastest way to create the report. If you want to be
able to change in the report you have to select Word or Excel. In
the internal tool the report will be shown in a preview window and
from there you can print the report.
Om du vill skapa ett diagram krävs att Excel
finns installerad i din dator. Ett av diagrammen kan If you want
to create a diagram you have to have Excel installed in your computer.
One of the diagram can show a warning level. If you want to see
this warning level you select the level in percent here by clicking
on the 'Warning flash' and state the percentage to the right.
If you click on the button 'Prev.'
you will go to the previous page in the module. The button 'Next'
takes you to the next step and 'Cancel' will terminate
the module. |
|
|
| |
|
|
|
© 2010 Copyright
DataPartner |
|
|
You are here: Resource - Statistics
|
|