| |
Status & interval |
|
Here you see step 5 for the report
'Interval'. At the previous picture you find the
description for the status report. The difference in the picture
below is that here you select 'Interval' by selecting 'Start time',
'End time' and 'Step'. This report shows a diagram with a breakdown
in different time periods within a day.
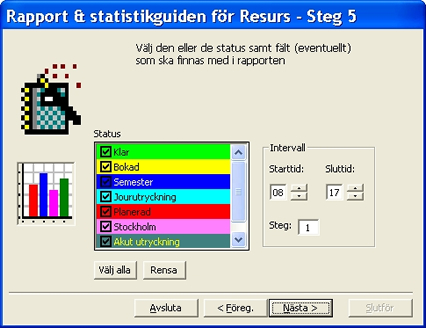
'Start time' refer to the first
time to be included in the diagram and 'End time'
the last time. If 'Step' is one (1) the report
will create a column for each hour between start time and end time.
If you state three (3) in 'Step' each column will
represent three hours in the diagram.
If you click on the button 'Prev.'
you will go to the previous page in the module. The button 'Next'
takes you to the next step and 'Cancel' will terminate
the module. |
|
|
| |
|
|
|
© 2010 Copyright
DataPartner |
|
|
You are here: Resource - Statistics
|
|